Impressive Launch Marred by Visual Data Errors
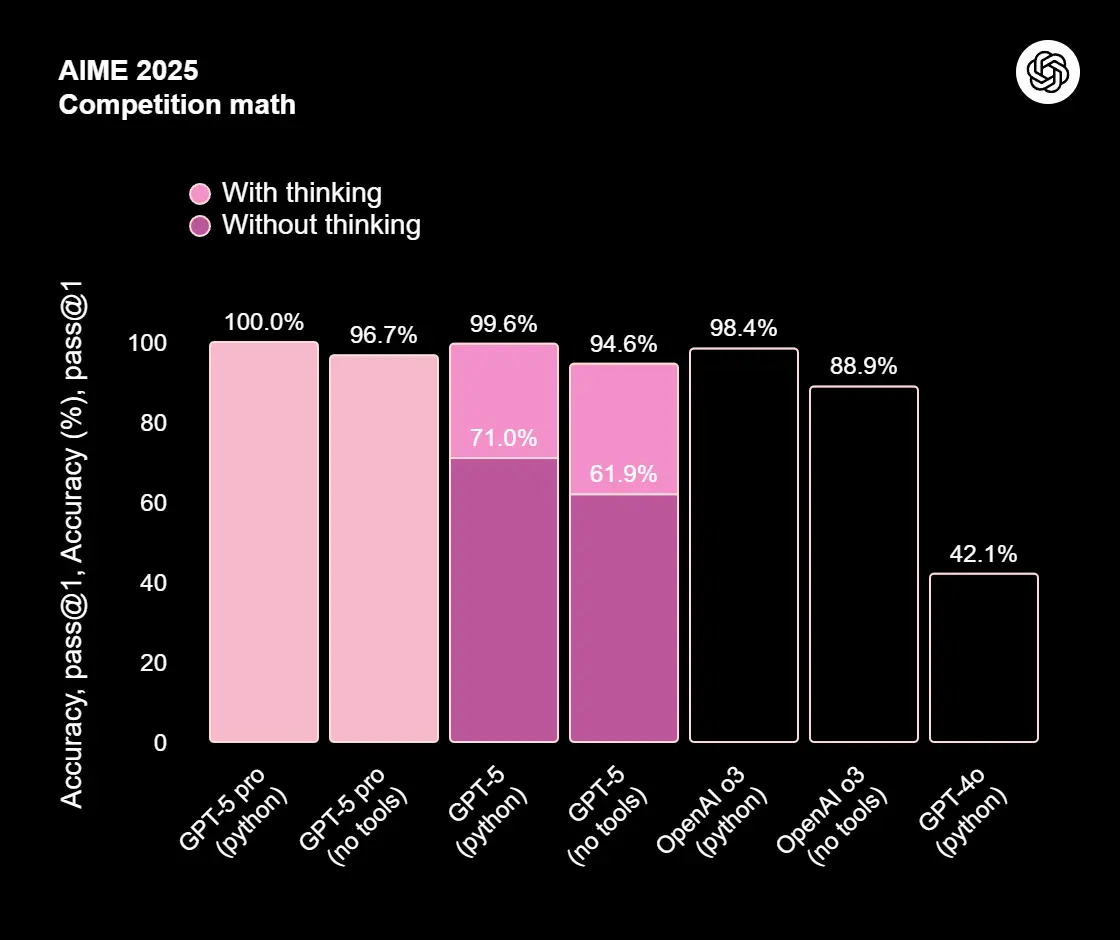
OpenAI’s much-anticipated GPT-5 demonstration, meant to showcase the model’s advanced data analysis capabilities, has unexpectedly stirred controversy after viewers spotted glaring mistakes in several generated charts. The live-streamed event, watched by thousands, included examples of GPT-5 creating data visualizations — but analysts and viewers quickly noticed mismatched labels, inaccurate scales, and misrepresented trends. Critics argue that while GPT-5’s natural language reasoning appears stronger than ever, its data visualization reliability remains questionable.
AI Accuracy vs. Presentation Quality Debate Reignited
Tech experts say the incident highlights a longstanding AI problem — even if the underlying calculations are correct, visual outputs can distort meaning if not precisely designed. In the GPT-5 demo, some bar graphs featured mislabeled axes, while pie charts had percentages that didn’t add up. OpenAI has not yet issued a detailed statement on the matter, but insiders suggest these errors could be linked to the model’s interpretation of ambiguous user prompts or its reliance on older training sets for visualization patterns.
Investors and Users Urge Caution Before Enterprise Rollout
Despite the hiccups, GPT-5’s potential remains significant, particularly in coding, document summarization, and reasoning tasks. However, industry observers warn that such visual inaccuracies could be damaging in sensitive domains like finance, healthcare, and government policy-making. Several enterprise clients have already requested clarification on how OpenAI plans to address these graphical inconsistencies before fully integrating GPT-5 into business workflows.
OpenAI Expected to Issue Patch or Clarification Soon
Sources close to the company claim OpenAI engineers are already working on improving chart-generation accuracy, possibly through real-time validation mechanisms. While the launch has generated global buzz, this visual data flaw may prompt a more cautious adoption curve, especially among data-heavy industries where even minor misrepresentations can lead to costly decisions.